Image Source: J. Albert Bowden II. Source License: CC BY 2.0. Adaptations: cropped, darkened.
Land use modeling is a quantitative method that uses existing and projected data combined with economic and social behavior theories to predict future changes in the types and longer term impacts of land uses. Computer modeling of alternative land use and transportation situations (scenarios) can contribute to a more measurable, and therefore more objective, planning process. Modeling can also add value to the planning process by providing opportunities to visualize complex systems and outcomes.
Why is this important to your community?
Modeling land uses allows decision-makers and residents to visualize and compare the potential impacts of land use change at a neighborhood, community, and regional-level.
By 2050, the CONNECT region is projected to add about 665,000 households, with a total population of 4,241,000 and 863,260 new jobs. The research through CONNECT Our Future planning process shows that he region is experiencing accelerated land consumption, a loss of working farms, demand for expensive utility expansion, impacts to environmental resources, and longer commutes and increased traffic congestion as a result of the current growth trends. The impacts of this growth will vary across each community and among their respective residents and businesses. Equipping decision makers and the public with the ability to measure, visualize, and compare these impacts can lead to a more balanced and functional set of future land use plans that are consistent with a regional vision, and also perform well at the local level.
A variety of models have been developed and are available to local governments and land planning authorities, primarily based on geographic information systems (GIS) data and software. Building a consistent baseline with the same set of assumptions as part of a regional land use framework will allow all aspects of land use planning to be easily compared across multiple municipalities. The greatest benefit scenario planning offers is more informed decision making, however, communities in the region have already benefited from the tools and data developed as part of the scenario planning initiative, by using the new data in their land use and transportation planning efforts.
This type of scenario planning helps communities prepare for the future by analyzing various future growth alternatives and considering how different growth patterns impact local priorities. Overall, scenario planning helps local decision-makers and the public understand local and regional impacts of different choices, providing an opportunity for regional dialogue on issues of mutual interest, to better coordinate local planning decisions. Scenario planning has been used in other communities and regions across the country and is considered a best practice for integrating transportation and land use decisions.
Skip directly to
How Does It Work?
Resources
Using the Tool
Partners
Where Has It Worked?
665000
new households in the CONNECT region projected by 2050
863260
new jobs in the CONNECT region projected by 2050
Where is it appropriate to use?
What priorities does it address?
- Support Our Communities
- Support Local Farms
- Reduce Commuting Costs
- Maximize Return on Public Investment
- Increase Transportation Choices
What other tools are related?
How does it work?
The process of “modeling” involves developing an abstract representation of a system to analyze its performance and identify opportunities for improvement. In community planning, modeling can be used to study a variety of elements and their potential impacts on populations, including economic development, the natural environment, transportation, and land use.
As regions and local municipalities make decisions about their future, models can serve as an important tool that provide comparable indicators and fosters the understanding of potential impacts. Although the process of modeling is complex and requires robust and current data from a variety of sources to maintain accuracy, the goal is to provide a focused, understandable, and actionable set of results. Land use modeling, in particular, has been used effectively to simulate proposed changes, analyze the impact of change across a range of indicators, and even produce visualizations of what that change will look like. By utilizing land use modeling, planners are able to more accurately assess the performance of a given community’s current land use configuration, and more effectively communicate what the potential impact of future variations will be to decision-makers and the public.
Ready to get started?
Using the Tool
Land use models are often developed at the regional level in coordination with transportation models, based on underlying GIS information and data sets that may include economic and environmental information, population projections, existing development, land use and zoning data,and data about the carrying capacity of the land and areas that are prone to new development. Since a regional framework has been established through the CONNECT effort using CommunityVIZ with an underlying set of assumptions, communities within the region will be able to build more targeted models to assist with localized planning efforts. (In addition to CommunityViz, a variety of land use models and software platforms are available, including UrbanSim, Envision Tomorrow, and GeoPlanner. Each program has specific input requirements and end product results, but all follow the basic process of trend and alternative scenario planning.)- Coordinate with the Centralina or Catawba Regional Council of Governments to access base data and up to date population and employment projections. Determine the type and format of the land use model that works for the scale and scope of the community or planning area. Work with the COG to ensure parcel data reflects any recent changes in land use or development. (Click to see the types of data Centralina and Catawba Regional COGs have available.)
- Develop a trend scenario that uses future population and employment projections to allocate future growth in a way that is consistent with current development patterns over a fixed area and fixed timeframe. The results of this analysis will represent the status quo, or “no change scenario” which can then be compared to a series of alternative scenarios that explore the outcomes of several variations to the existing trend within the same fixed area and fixed timeframe.
- Work with the community and local stakeholders to develop alternative growth scenarios that vary from the trend, and aim to advance local goals and a regional vision. These variations can include changing the allowable density or intensity of development in certain areas, or reconfiguring land uses such as more or less residential area, introducing mixed-use areas, or transitioning industrial areas into more flexible work environments.
- Identify potential indicators that will be used to compare the impact of each scenario, and measure progress toward reaching the community’s goals. Modeling the trend scenario as well as various alternatives to that trend result in a series of environmental, economic, and social indicators that allow decision makers to make judgments based on easily-comparable information. These indicators can range from specific numbers such as the total number of vehicle miles traveled in one scenario compared to another, or acres of open space, to more complex concepts such as access to quality open space, or neighborhood walkability.
- Summarize the outcomes of each land use model and indicator results that measure the various impacts of the proposed growth scenarios. Organize this information and present to decision-makers and the public as a way facilitate discussions about potential future land use decisions.
- Identify a preferred scenario, or combination of scenarios, that most effectively meets the goals of the community by mitigating potential negative impacts and leveraging investments associated with new growth.
Partners
- Community Development Organizations
Where has it worked?
Integrated Regional Land Use Planning: Community Viz - El Paso, Teller, and Pueblo Counties, CO
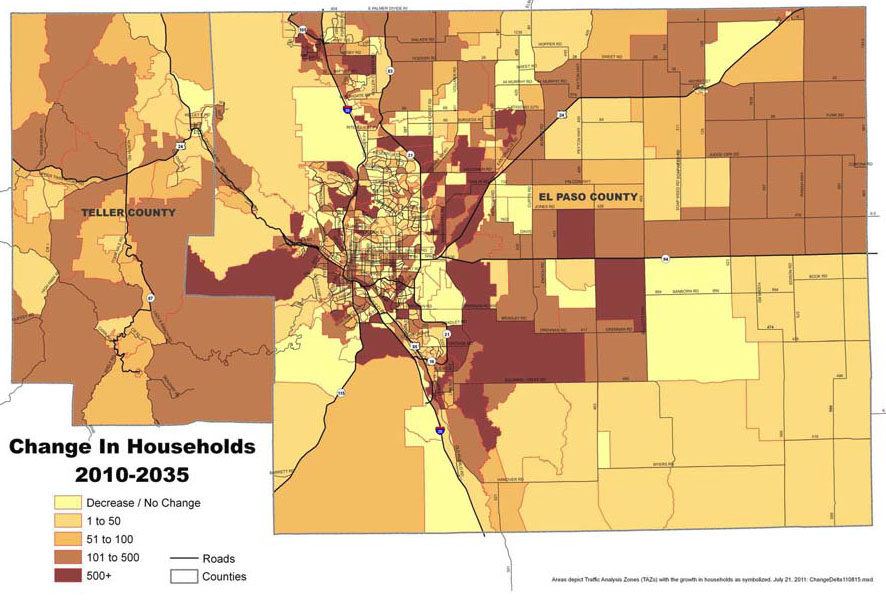 Image Source: Pikes Peak Area COG.
Contact
Tom Miller, GIS Planner/Geographer/Analyst
TMiller@ppacg.orgAbout the Program
The Pikes Peak Area Council of Governments (PPACG) in southern Colorado is a regional planning agency with a territory that is projected to grow from 700,000 to 1 million over a thirty year planning period. The Council started a regional planning process in 2007 with the goal of integrating land use and environmental conservation principles with transportation planning. The planning team identified a specific scenario-planning tool for three elements, to develop scenarios that could be combined into a final single preferred future for the region:
- Land Use Model:
CommunityViz for land use planning and overall scenario development
- Environmental Conservation Model:
NatureServe Vista, with sensitive species data from the Colorado Natural Heritage Program (CNHP) for conservation planning,
- Transportation Model:
PPACG (as the designated Metropolitan Planning Organization) used its’ existing transportation model
Why it works
The process began by developing a Current Trend plan that showed how growth would likely occur by the year 2035. Two alternative scenarios were developed using CommunityViz. One scenario focused growth on infill clusters, while the other prioritized the protection of environmentally sensitive areas. To remain consistent with the transportation model, each scenario used traffic analysis zone polygons as the primary level of detail. In the Infill/Cluster scenario, the planning team identified opportunities to increase development intensity in areas adjacent to transit. For the Conservation scenario, the team used data from CNHP and NatureServe Vista to select land areas that were particularly sensitive. The associated parcels were designated as unbuildable to show an extreme conservation strategy.
For each scenario, jobs and housing units were allocated across the area by overlaying the conditions of the scenario against the likely desirability for development. According to the lead consultant for the scenario development, an interesting outcome of the extreme conservation scenario was that growth “leap frogged” over a large, environmentally sensitive tract close to downtown and spread into more remote rural areas, producing unwanted side-effects (e.g., long commutes and dispersed growth). In response, a modified conservation scenario allowed some dense, highly clustered development in one of the less sensitive areas of the affected tract.
PPACG then used CommunityViz to calculate a wide variety of performance measures and indicators to compare the scenarios. In addition to standard indicators such as vehicle miles traveled and land use mixes, many indicators measured potential adverse impacts to sensitive places and populations.
To develop a preferred scenario as the basis of the Regional Transportation Plan, PPACG hosted a stakeholder workshop with its Technical Advisory Committee. Working with live CommunityViz analysis in small groups, participants moved residential and jobs density around on the map to improve the original scenarios. After each small group came up with a proposal, CommunityViz was used to merge their maps into a single combined proposal which was fine-tuned by the entire group.
Pikes Peak Colorado: http://placeways.com/PDFs/planning/PikesPeak.pdf
- Support Local Farms